
I have been interested in how to make use of Panopto content in our Salesforce site internally, and I think it is worth sharing with the community as well.
Two examples follow. For each, it is best to have secure protocol enabled and to specify HTTPS URLs. You can add the code snippets to any Apex VisualForce page you want. Keep in mind who has permission to see the sessions, because private sessions are still restricted when shared in these embeds. So if your coworker doesn’t have access to the video normally, she also won’t be able to view it in the embed without you updating the sharing permissions.
Example Apex code to embed a session:
<apex:page>
 <apex:iframe src="https://demo.hosted.panopto.com/Panopto/Pages/Embed.aspx?id=dbaef247-4589-4d83-95cd-5dc73bdf1694&v=1" scrolling="false" id="embeddedVideo"/>
 </apex:page>
Which looks like this:

Example Apex code to embed a folder:
<apex:page>
 <apex:iframe src="https://demo.hosted.panopto.com/Panopto/Pages/Sessions/List.aspx?folderID=e4c6a2fc-1214-4ca0-8fb7-aef2e29ff63a" scrolling="true" id="embeddedVideoList"/>
 </apex:page>
Which looks like this:

Steps to add a new Panopto Visualforce page:
1. Set up a new Visualforce page. If you haven’t done this before, they have a nice walkthrough here:
https://www.salesforce.com/us/developer/docs/pages/Content/pages_quick_start_hello_world.htm
2. Look up the session or folder ID for the item you want to embed. For a session, you want the delivery ID. You can get it from the “Manage” tab for your session:

For a folder, you also go to the “Manage” tab and use the folder ID:

3. Copy the Apex code I shared above, and replace the URL with the domain name of your Panopto server and the folder or session ID you want to share.
4. Check the permissions to make sure your audience can access the files. You may want to share with everyone who can log in, for example. This is in the “Share” tab for the session or folder:

That’s all you need! I hope this helps you use Panopto more places!
Note: This is cross posted from the Panopto developers’ community.

When sharing content with coworkers in Sharepoint, it can be nice to drop in an embed of a video or a list of videos to make Panopto videos easy to find.
I have two examples to share here. One is to embed a single video, the other for a list of videos. For each case, it is best to have secure protocol enabled on the Panopto server and to specify HTTPS URLs.
Keep in mind who has permission to see the sessions, because private sessions are still restricted when shared in these embeds. So if your coworker doesn’t have access to the video normally, she also won’t be able to view it in the embed without you updating the sharing permissions.
Example HTML code to embed a session:
<iframe src="https://demo.hosted.panopto.com/Panopto/Pages/Embed.aspx?id=dbaef247-4589-4d83-95cd-5dc73bdf1694&v=1" width="900" height="600" frameborder="0"></iframe>
Which looks like this:

Example HTML code to embed a folder:
<iframe src="https://demo.hosted.panopto.com/Panopto/Pages/Sessions/List.aspx?folderID=e4c6a2fc-1214-4ca0-8fb7-aef2e29ff63a" width="1050" height="1050" frameborder="0"></iframe>
Which looks like this:

How-To:
Steps to add a new Panopto video to a Sharepoint page:
1. Set up a new Sharepoint page where you want to include Panopto content.
2. Click Insert -> Embed Code

3. Look up the session or folder ID for the item you want to embed. For a session, we provide the full HTML code for you. You can get it from the “Outputs” tab for your session:

For a folder, grab the Folder ID from the “Manage” tab and paste it into the example HTML I share above.

4. Paste the HTML code into the Sharepoint Embed prompt.

5. You may want to update the width and height for a better layout.

6. Save the page in Sharepoint

7. Check the permissions to make sure your audience can access the files. You may want to share with everyone who can log in, for example. This is in the “Share” tab for the session or folder:

That’s all you need! I hope this helps you use Panopto more places!
Note: This is cross posted from the Panopto developers’ community.

As soon as I had a free Hackathon day at my new job, I couldn’t help but do a project that spanned from old interests to new. Let’s dig into how to build a PivotViewer view of Get Satisfaction data.
For those of you who want code right now, please see my GitHub page with the Silverlight code. I am using C#, the Silverlight 5 toolkit, and the PivotViewer v2 control that is found in the Silverlight 5 SDK.
For those of you who want pretty and dynamic infographics right now, I have a hosted version of this PivotViewer app. That link goes to:
https://sfn-hosted-customizations.s3.amazonaws.com/GSinPV.html?q=get%20satisfaction
Note that the “q=” is a query parameter and can be set to whatever you want.
Now that the intro is over, what is this Silverlight page anyway? PivotViewer is a project that originated in Live Labs and explored how to use the concept of both visually and data-wise zooming and filtering through data in a way that is easy to explore. The initial view of the data on this page is a set of Get Satisfaction communities that are returned when you do the keyword search based on the parameter you pass in the URL. (UX peeps avert your eyes, passing a search query in the URL is not a piece I am proud of.)

There are buttons on each of the communities that do three things:
- Open the Community
- Look at Community Topics in PivotViewer
- Look at Community People in PivotViewer
If you look at the Topic or People data in PivotViewer, you can sort through that data using the graph view (the button at the top right to make it into a histogram of the data points). You can also filter it using the filter panel on the left hand side.
Here is a snapshot of Topics from Coffee for Less:

And here is a People snapshot from Pampers:

Here are some technical implementation details:
- JSON Requests are made from Javascript
I found it too constricting to work within the Silverlight framework to make JSON requests across domains. Javascript handles this much more gracefully. I created handlers for the JSON replies in Javascript and then passed the data to the C# code to actually add it to the Silverlight viewer. to pass data back to Silverlight, I mark functions as scriptable members.
- Classes model the whole JSON reply, even when I don’t use the fields.
I created full classes of all the data that was returned in the JSON. This is handy if you want to copy my code to use C# for your own project. I just didn’t use all the fields.
- The code is complex because I am reusing the same Silverlight app
I think this would look much simpler if I wasn’t reusing the same Silverlight app to host three different data schemas. This meant I had to think through three different layouts for the items, three different sets of properties, and three different sets of adorners. To simplify, these could have been on distinct pages, but I liked the flow all on one page from a UX perspective.
- Templates for objects and adorners are in XAML
I tend to like to define as much of the layout and adorner logic as possible in XAML. These can also be managed in the code behind, and this is a stylistic choice I made. The meat of the project is in MainPage.xaml and MainPage.xaml.cs
I hope this is helpful both in getting started with the Get Satisfaction API and with Silverlight 5 and the PivotViewer control.

I’ve been hoping to share a super simple sample app to showcase PivotViewer in Silverlight 5. I hope this walk through is something you will find useful!
First, let’s take care of the pre-requisites:
- Install Visual Studio 2010 SP1:
http://www.microsoft.com/download/en/details.aspx?displaylang=en&id=23691
- Notes for the RC of Silverlight 5:
http://www.silverlight.net/learn/overview/what%27s-new-in-silverlight-5
- Download and install the Silverlight 5 Runtime and Tools for Visual Studio using the links on that page.
Once you get the pre-reqs, create a new Silverlight application. If you haven’t done this much before, here is a handy link:
- How to create a Silverlight project from scratch (replace 4s for 5s as appropriate):
http://msdn.microsoft.com/en-us/library/cc838164(v=VS.95).aspx
Now, let’s add a PivotViewer. I want to view people by age and birthday. You will need to edit the MainPage.xaml and MainPage.xaml.cs files and add a reference to System.Windows.Controls.Pivot.
MainPage.xaml:
 <UserControl x:Class="Birthdays.MainPage"
    xmlns="http://schemas.microsoft.com/winfx/2006/xaml/presentation"
    xmlns:x="http://schemas.microsoft.com/winfx/2006/xaml"
    xmlns:d="http://schemas.microsoft.com/expression/blend/2008"
    xmlns:mc="http://schemas.openxmlformats.org/markup-compatibility/2006"
    xmlns:pv="clr-namespace:System.Windows.Controls.Pivot;assembly=System.Windows.Controls.Pivot"
    mc:Ignorable="d"
    d:DesignHeight="300" d:DesignWidth="400">

    <Grid x:Name="LayoutRoot" Background="White">
        <pv:PivotViewer x:Name="pivotviewer" ItemsSource="{Binding}">
            <pv:PivotViewer.PivotProperties>
                <pv:PivotViewerStringProperty Id="Name" Options="CanFilter" DisplayName="Name" Binding="{Binding Name}" />
                <pv:PivotViewerNumericProperty Id="Age" Options="CanFilter" DisplayName="Age" Binding="{Binding Age}" />
                <pv:PivotViewerDateTimeProperty Id="Birthday" Options="CanFilter" DisplayName="Birthday" Binding="{Binding Birthday}" />
            </pv:PivotViewer.PivotProperties>
            <pv:PivotViewer.ItemTemplates>
                <pv:PivotViewerItemTemplate>
                    <Border Width="200" Height="200" Background="DarkSlateBlue">
                        <TextBlock Text="{Binding Name}" FontSize="30" FontFamily="Georgia" Foreground="White" HorizontalAlignment="Center" VerticalAlignment="Center" />
                    </Border>
                </pv:PivotViewerItemTemplate>
            </pv:PivotViewer.ItemTemplates>
        </pv:PivotViewer>
    </Grid>
</UserControl>
MainPage.xaml.cs:
using System;
using System.Collections.Generic;
using System.Windows.Controls;

namespace Birthdays
{
    public partial class MainPage : UserControl
    {
        public MainPage()
        {
            InitializeComponent();

            List<Person> birthdayBook = new List<Person>();
            birthdayBook.Add(new Person("Brad", 25, new DateTime(1986, 5, 9)));
            birthdayBook.Add(new Person("Janet", 12, new DateTime(1998, 12, 3)));
            birthdayBook.Add(new Person("Rocky", 43, new DateTime(1968, 7, 17)));
            birthdayBook.Add(new Person("Magenta", 21, new DateTime(1990, 2, 21)));

            pivotviewer.DataContext = birthdayBook;
        }

        public class Person
        {
            public string Name { get; set; }
            public int Age { get; set; }
            public DateTime? Birthday { get; set; }

            public Person(string name, int age, DateTime? birthday)
            {
                this.Name = name;
                this.Age = age;
                this.Birthday = birthday;
            }
        }
    }
}
Conclusion
When I compile the code above, I get the sample PivotViewer collection I snapshotted. It should be incredibly easy. You can bind to any data type, you can use whatever object definitions make sense for your data.
Please do let me know if there are tweaks that would make this sample even easier or more clear!
I’ve made a few variations on this PivotViewer demonstration, and it felt like a good time to add it to the blog as well.
The powerpoint presentation gives a nice overview of both how to design a good collection and how to go about the technical details of implementing a Silverlight 5 application that uses the new PivotViewer. There are some short code snippets and helpful links to guide you through getting started.
Here are a few slide images:
-

- Dealing with Large Data Sets using Populations
-

- Design for Different Levels of Zoom
It was so neat to work with the AstroInformatics folks. They allowed me to present via Skype and helped by doing the slide presentation locally. It went very well and the only real downside was there was too little time to get into Q&A. Thank you Microsoft Research and Cal Tech for the opportunity!
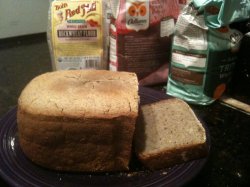
I wanted to do some research on Tritamyl flour, a grain used by Odlums for their gluten free flour as of a few years ago. This is an Irish company with little reach beyond Ireland and Great Brittan, so I expected to see reviews from either of the countries they supply. Instead I get American naval-gazers who haven’t ever seen or tried the stuff pontificating on web forums about how they would never touch a thing they don’t understand.
Needless to say, my search was futile.
And the problem is that search has been optimized for local shopping. The engines are not built to anticipate someone actually wanting input from someone else who lives in another country and is being sold to by different companies. Search is a servant to ads, ads only make sense when they can drive revenue, I can follow this short causal chain of evidence.
Is any ad-driven web technology doomed to become an isolating, ad-driven enterprise? No wonder people only see opinions like their own when then roam the web, all of the services have been tuned to sell to a niche that they are in, thereby bypassing the wealth of opportunity hidden in the great diversity of people each site serves.
Facebook has users from 213 countries. Why am I always talking with people from (primarily) one? Google supports 104 languages, but how weird would it feel to see a result not in English? There is a spectrum between experiences that expand your views and those that contract them, and perhaps the pendulum needs to move back towards the broadening end once more.
An interesting addendum to my last post about a tag cloud:
I knew I was on the right path when a dramatic shift happened. I had a data set, it was rendering on screen with a few different parameters and layouts, I was iterating quietly.
When I finally got the data hooked up to the triangle layout that Goldie had envisioned, a trend was immediately clear. The sample data was all clumping into a small number of regions instead of using the full space. I looked back at the data itself and it was true! I had mindlessly generated data with subconscious trends in it! It didn’t take long to get the data cleaned up. Because I had the tool working, I could also get instantaneous feedback that it was working.
When it comes to any kind of data, measuring the quality of the data and tracking outliers is so much easier when you have the right tools in place. The scientific hypothesis process can also be applied to data quality assurance, like when querying on bug databases to find underlying root causes and trouble spots. Then, in turn, the ability to immediate grok trends is a measure of feedback about the quality of the data visualization tool itself.

A friend, Goldie, and I put together a poster proposal for the Grace Hopper 2011 conference on using lightweight and fun data visualization tools on web services. The title is a bit cheesy, since I wanted to shoe-horn in the “what if?” theme: “What if Social Network Data was visualized for Human Intuitive Consumption?”
The theme revolves around what visual cues are intuitive to grasp and useful when consuming large amounts of data. The tactic of using a 10 Blue Links clone in order to present a feed of information about your social group really doesn’t leverage what we know about how people read and share content. Especially if you are looking for something in your social network, there is a mismatch between how people socialize and how websites make it look like people socialize.
To explain, I will share a triangle tag cloud below. The idea driving this particular visualization is that in the maker space, creative fields are starting to blend together into more and more interdisciplinary sub-fields. We’ve broken down all the fields we could come up with, culled from Instructables, Make Magazine, and our own personal experience, to create three dimensions: Art, Craft, and Tech. In 2D monitor land, what’s a metaphor for three dimensions? Color seemed like a good fit, so you’ll see that each field has a relative percentage of cyan, magenta, and yellow. The layout is based on an isometric projection of x, y, and z axes onto a plane, giving roughly a triangle shape. The actual placements are a bit fuzzy, but we figured we could leave that to crowd-sourcing.
Along this theme of making data visualizations lightweight and fun, here is the app I have been working on in my spare time, user interface design by Goldie:
http://thecollabotron.com/tagCloud.html
(NOTE: Requires canvas, so sorry IE-using folks! You won’t see anything.)
Getting zooming and panning took some help from Ben, another ex-Live Labber, but once I got the basics in place, they are really handy mechanisms. Dynamically re-laying out based on user input is still pretty rudimentary, but this is my first stab at it. I hope to get some user feedback (comment below even!) on this kind of prototype to use for the Grace Hopper poster, if they accept it. Fingers crossed!
Two things strike me when it comes to Twitter’s warning that people hold off on making client tweet consumption experiences. First, what hubris! As if all users must consume in the same way. I agree that it is lame to look at a service that provides a linear lame list of text and just reproduce that same experience. Not surprisingly I am partial to http://percollate.com‘s solution. Different people want to consume data in different ways. If you still think text data has to come in long, vertical lists, you must also still think search data actually belongs in ten blue links.
Secondly, what a way to kill your ecosystem, to discourage experimentation with your API. Find a different monetization strategy other than ads in your app, assuming that is your roadmap, which I have to since you won’t release it.
On a final note, with my personality, this kind of annoucement makes me want to flaunt the request. So maybe Twitter is just crazy sneaky and wants more client apps!
I’ve made no secret to my coworkers that I want Microsoft to be a big presence at the Anita Borg Institute’s Grace Hopper Conference 2011. It will be in Portland, OR, which is practically Redmond’s backyard. So in order to back up my enthusiasm with real substance, I have been cooking up some ideas to submit for posters, panels, talks, sessions, lots of good stuff. Too much in fact. Hee.
I have to admit that what I wanted to do was talk or write about mid-career attrition. It is a topic close to my heart! How can women get to the boardroom unless they go through mid-career growing pains first? And, well, I am not finding the punchline I was looking for. Very interesting turn of events, and hopefully I will be able to sort things out enough to share the details. Needless to say, complex populations like mid-career women technologists just don’t fit into tidy little boxes!
